 |
|
| Home | Marine Aquariums |
Freshwater Aquariums |
Planted Aquariums |
Brackish Systems |
Ponds,
lakes & fountains |
Turtles & Amphibians |
Aquatic Business |
Aquatic Science |
Ask the WWM Crew a Question |
| Please visit our Sponsors | ||||
Our eyes have photoreceptors that sense different wavelengths representing colors. They are sensitive to short, medium, and high nanometer wavelengths (420-440, 530-540, and 560-580). Corals also have similar receptors and positively react to intensity and wavelengths in the PUR spectrum which is 400-550 and 620-700nm.
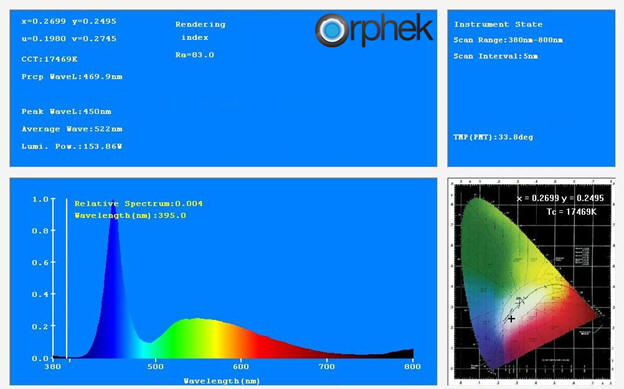
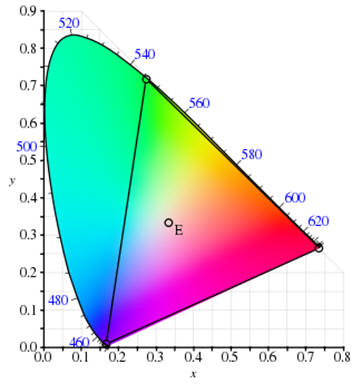
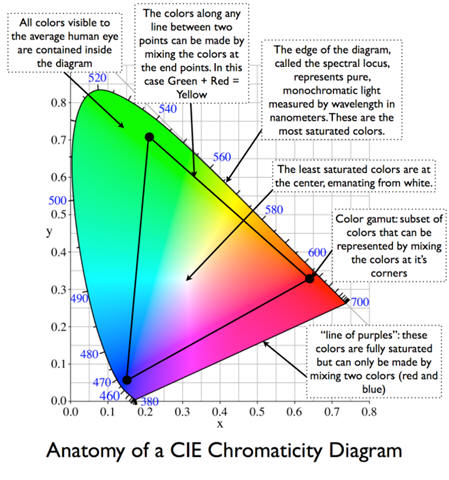
Orphek’s design team uses spectrographs generated by a spectrometer and most importantly, a CIE RGB color chromaticity chart. This chart maps a range of physically produced colors as well as the intensity of the colors. Without a chromaticity chart or map, a spectrograph alone is not useful. Orphek uses both for a meaningful report of their LEDs ability to produce light corals positively respond to. The chromaticity chart maps a full plot of all visible colors and is divided into two parts; brightness and chromaticity. The color white is considered a bright color while grey is generally considered to be a less bright version of that same white. The CIE XYZ RGB color space is designed and read so that the "Y" parameter is a measure of brightness or luminance of a color. X is a mix (a linear combination) of cone response curves. The chromaticity of a color is then specified by the parameters x and y. If you choose any two points of color on the chromaticity chart, then all the colors that lie in a straight line between the two points can be formed by mixing these two colors. The total amount of colors must be convex in shape and all the colors that can be formed by mixing these sources are found inside the triangle which is formed by the source points as shown below.
"E" represents the area where the least color saturation occurs. If one chooses any two points of color on the diagram, then all the colors that lie in a straight line between the two points can be formed by mixing these two colors. It follows that the gamut of colors must be convex in shape. All colors that can be formed by mixing three sources are found inside the triangle formed by the source points on the diagram.Chromaticity charts are useful for LED pendants that have multiple channels because it can aid in adjusting the channels to create the optimum spectrum for corals. Of course this will depend on the color(s) of the LEDs in each channel and if the manufacturer furnishes a chromacity chart for each channel. Most of us are not going to go through this extreme but nonetheless it is interesting to note.
It is very important when choosing LED lights for your reef tank to view the manufacturer’s spectrograph as well as their chromaticity chart on their product. It is equally important to see if any there is any change in the spectrum when dimming the LEDs; there should be none or very minimal.
|
|

|
Features: |
|
| Featured Sponsors: |